This topic is closely related to the topic of quadratic equations. We will discuss further on 4 subtopics below:
1. The Basic of quadratic functions
2. Determine max and min values of quadratic function
3. How to sketch the graph of quadratic functions
4. How to find the range of values of x in Quadratic inequalities
1. Basic concepts of quadratic functions
is the quadratic equation, while
is quadratic function, with the highest power of x in the function is 2.
is not a quadratic function since the highest power of x is 3.
Notice the difference of the function? Yes, it is the negative sign ( – ) making the graph looks different. If a > 0, the parabola opens upwards with a minimum point, eg . If a < 0, the parabola opens downwards with a maximum point, eg
. Max and min point are known as turning point of the parabola. We will discuss on how to find out the min or max point later by using completing the square method in the section “Determine max and min values of quadratic function”.
We have learned previously on how to determine the condition of the type of roots for a quadratic equation using discriminant . If a quadratic function
is given and need you to determine the type of roots, the same concept is applied. Look at example 1.
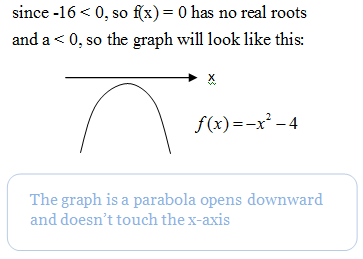
Example 1: Determine the type of roots for quadratic equation f(x) = 0 of each function f(x), and determine the position of the graph.
a)


b)
Answer:
a)
b)


1. Determine max and min values of quadratic function
How to determine the maximum and minimum values of the quadratic function? It’s simple, express the quadratic function into the form of
, if a > 0, we got minimum value q, and with a minimum point of (-p,q). Where else if a < 0, we got maximumvalue q, and maximum point of (-p,q). The minimum point or maximum point is also called the turning point of the function.
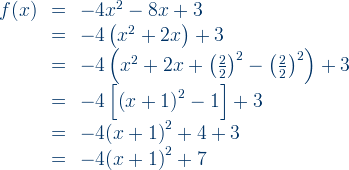
Use completing the square method to convert
to
Example 2: Determine the minimum value of each quadratic function and the value of x.
a)
b)
Example 3: Determine the maximum value of each quadratic function and the value of x.
a)
b)
3. How to sketch the graph of quadratic functions
Steps:
- Determine the shape of the graph, if a > 0, it opens upward. If a < 0, it is downward.
- Find the value of discriminant
in order to determine the position of graph.
- Determine the max or min point of the graph.
- Solve f(x) = 0 (determine the point at x-axis, if y = 0)
- Solve f(0) (determine the point at y-axis, if x = 0)
- Use all the points found to draw the graph.
Example 4: Sketch the graph of
Solutions:
1. a > 0, graph is upward
2. a = 1, b = 2, c = – 8
3. a > 0, so the minimum point is
4. f(x) = 0 / y = 0
5. if x = 0, f(x) = – 8,
6. draw the graph as below
4. How to find the range of values of x in Quadratic inequalities
In general function , we could determine the range of value of f(x) > 0 or f(x) < 0 by steps below:
1. Check the positive or negative sign of a, if it is negative, switch the position until it becomes positive so that the graph always open upward. (Will be explained in example 6 later)
2. Solve the function (Use f(x) = 0)
3. Sketch the graph
4. Determine the range of value of x.
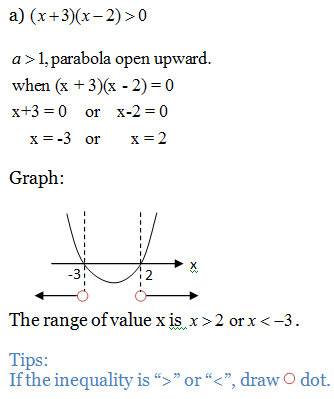
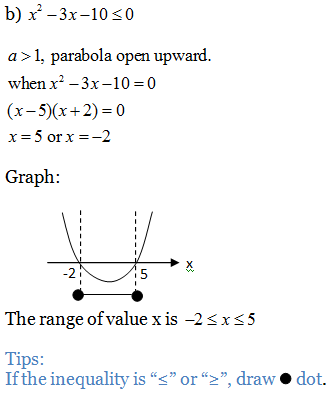
Example 5: Determine the range of value of x for quadratic inequalities below.
Example 6: Find the range of values of x for
We will look at more SPM questions for quadratic function on the topic SPM Questions for Quadratic Functions.
Related Content:


